
|
| [ Home ] [ Manage Datasets ]
[ Supplementary files ] [ User manual ] [ About ]
You are logged in as . [logout] |
|
1. Overview 2. Analysis modules 3. Motif & Expression 4. Expression & Expression 5. Motif & Function 6. microRNA search 7. Data upload |
mESAdb - motif & expression |
|
|---|---|---|
|
miRNAs are tissue-specific; and this specificity might be associated with certain sequence characteristics. Motif & Expression module allows for visualization of a particular microarray dataset focusing on tissue-specific expression of microRNAs in various species (mice, humans and zebrafish). Correspondence analysis is a multivariate technique, which can superimpose the rows and columns of a dataset on the same set of dimensions. This makes possible to identify which miRNAs are likely to be expressed in which tissues.
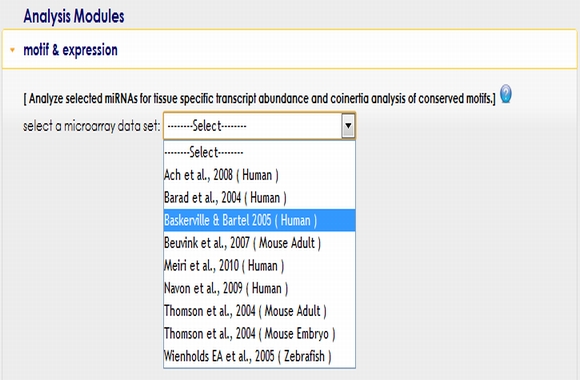
To start using Motif & Expression module, you first need to select a microRNA expression data set from the pull down menu. |
||
|
||
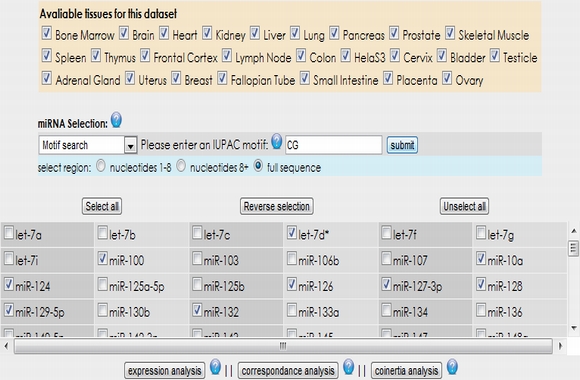
After your selection, the microRNAs and tissues existing in the selected expression data set are listed. Then, you can select microRNAs manually or according to their sequence properties from the data set. You can also upload your own microRNA list (see example text file) by selecting "miRNA list upload" option from the pull down menu. Additionally, "select all", "reverse selection" and "unselect all" buttons make easy the selection or unselection of microRNAs. After you select your microRNA subset, you can carry out expression, correspondence or coinertia analysis using the appropriate button.
 In expression analysis, expression values of two groups, selected and non-selected microRNAs, are represented by bar chart. It is also possible to access correlation information of the selected tissues and expression values of all microRNAs existing in the selected data set by selecting the appropriate option from the data table menu. 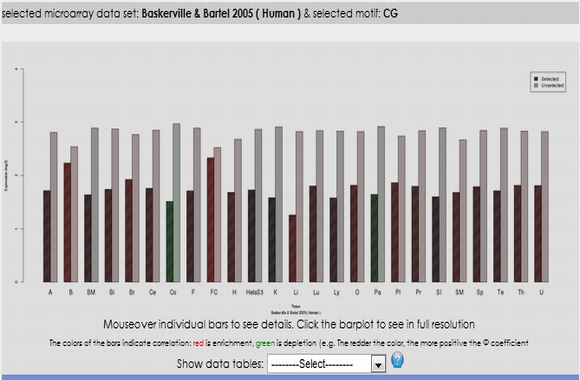 To view plots generated from correspondence analysis of a microRNA subset, you need to click "miRNAs", "Tissues" and "Correspondence" tabs located above the plot. You can also see the definition of each plot by moving your mouse cursor over the blue question mark symbols. 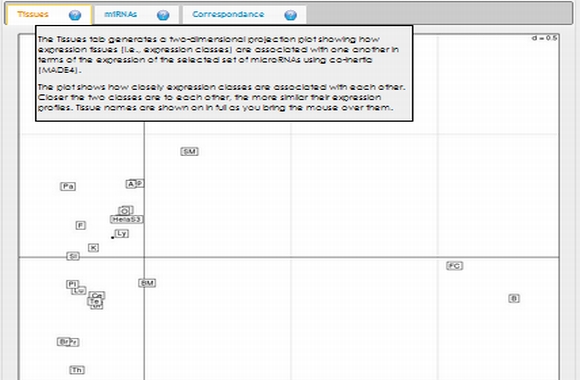 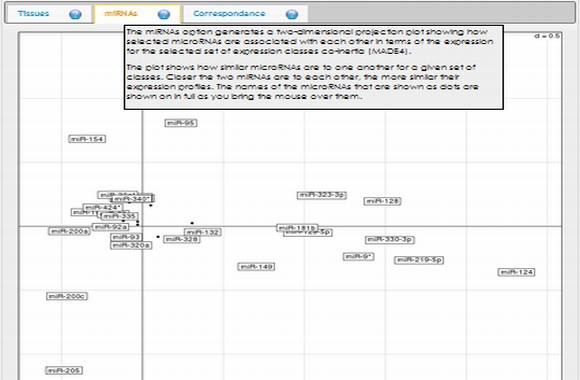 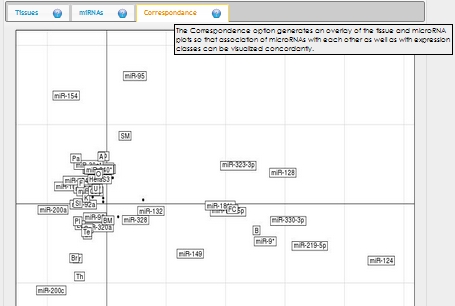 Coinertia analysis of a microRNA subset calculates the RV coefficient value between tissue and motif datasets. In order to see full name of any tissue on the plot, you need to move your mouse cursor over the data point. Additionally, to see expression profile of a nucleotide motif as a bar chart, you just need to click that data point representing the nucleotide motif in question. 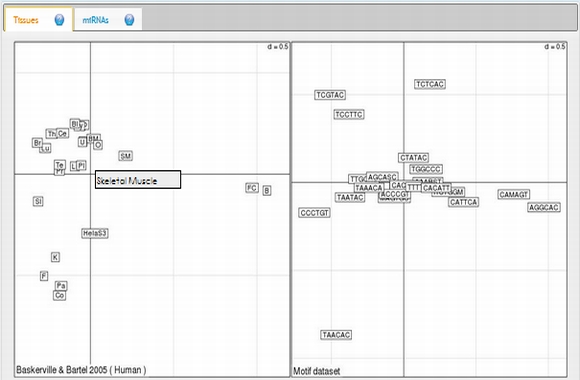 In this page, it is also possible to see coinertia plots of a microRNA subset in three different ways: (1) labelled, (2) unlabelled and (3) clustered. You only need to click on a cluster number in case you wish to see expression profile of that cluster. 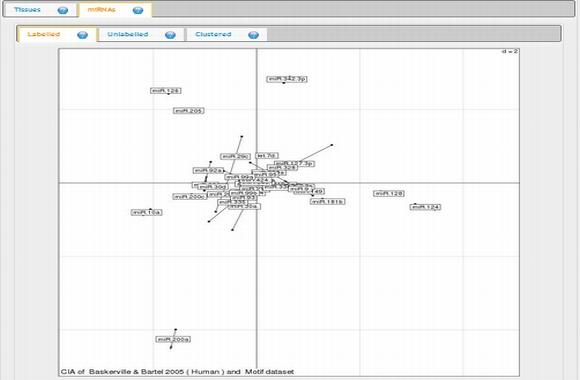 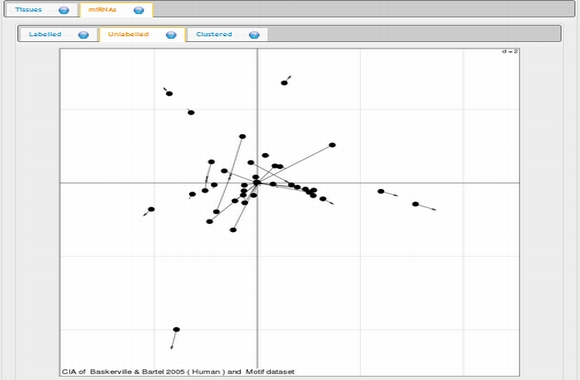 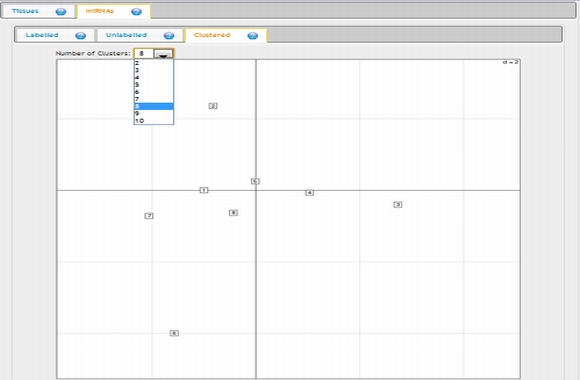 |
||
| [ Home ] [Manage Datasets] [ Supplementary files ] [ User manual ] [ About us ] [ Logout ][ HelpPoints Off] mESAdb was developed for and tested on Chrome, Firefox and Safari. Please use one of these browsers for the best experience. Copyright © 2010 Konu Lab - Bilkent University Additional copyright & license information. |