
|
| [ Home ] [ Manage Datasets ]
[ Supplementary files ] [ User manual ] [ About ]
You are logged in as . [logout] |
|
1. Overview 2. Analysis modules 3. Motif & Expression 4. Expression & Expression 5. Motif & Function 6. microRNA search 7. Data upload |
mESAdb - expression & expression |
|
|---|---|---|
|
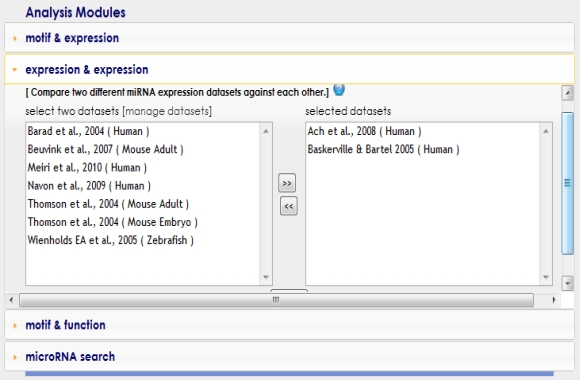
Meta-analysis of miRNA microarray datasets might help determine the consistency of expression across multiple but similar studies. Expression & Expression module makes possible the assessment of similarity of expression between microarray datasets focusing on tissue specificity of miRNAs. The module can compare human, mouse and zebra fish datasets, within species and between species. A coefficient measuring the similarity between datasets also is calculated. The comparisons can be performed for a selected set of common miRNA species across a given set of tissues.
It is needed two microRNA expression data sets to carry out coinertia analysis in Expression & Expression module. |
||
|
||
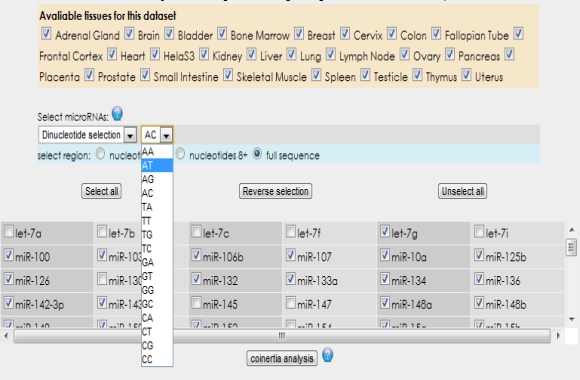
After selection of expression data sets, the microRNAs and tissues existing in the selected expression data sets are listed. Then, you can select microRNAs manually or according to their sequence properties for coinertia analysis. You can also upload your own microRNA list (see example text file) by selecting "miRNA list upload" option from the pull down menu. Additionally, "select all", "reverse selection" and "unselect all" buttons make easy the selection or unselection of microRNAs. After you determine your microRNA subset, you can calculate the RV coefficient and draw coinertia plots for the selected data sets by clicking "coinertia analysis" button located the microRNA list menu.
 The RV coefficient value between the selected two data sets can be found at above coinertia plots. In order to see full name of any tissue on the plot, you need to move your mouse cursor over the data point. Additionally, "Tissues", "miRNAs" and "Heatmaps" tabs located on the top left corner of coinertia plots provide visualization of other analysis results by plots and heatmaps. 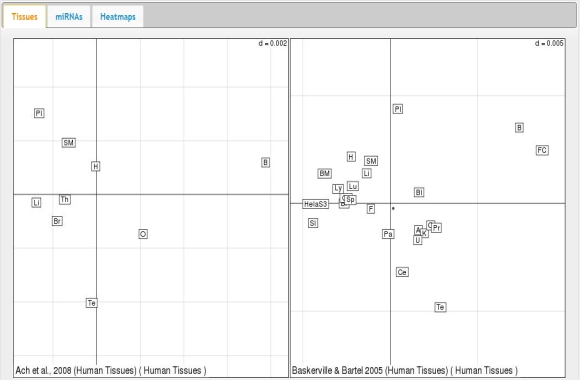 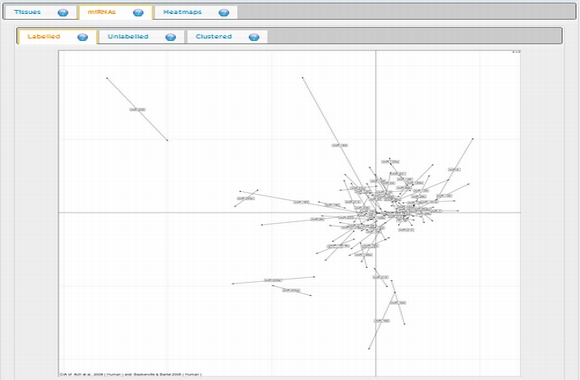 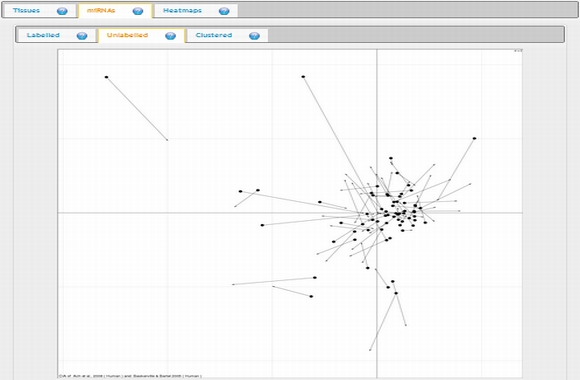 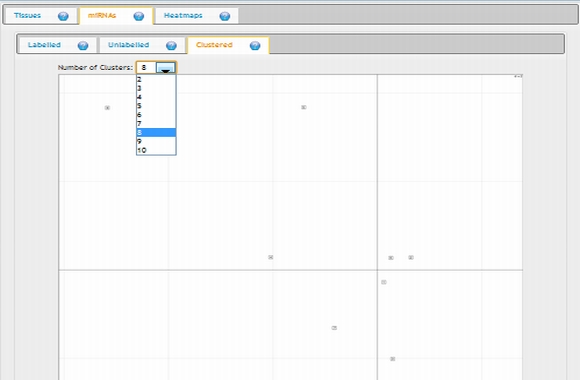 To view a heatmap in its actual size, you need to click on the heatmap. 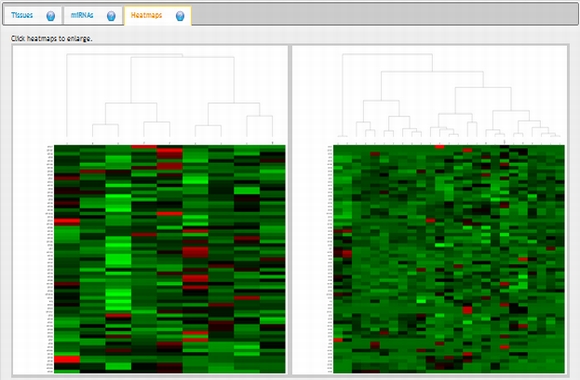 |
||
| [ Home ] [Manage Datasets] [ Supplementary files ] [ User manual ] [ About us ] [ Logout ][ HelpPoints Off] mESAdb was developed for and tested on Chrome, Firefox and Safari. Please use one of these browsers for the best experience. Copyright © 2010 Konu Lab - Bilkent University Additional copyright & license information. |